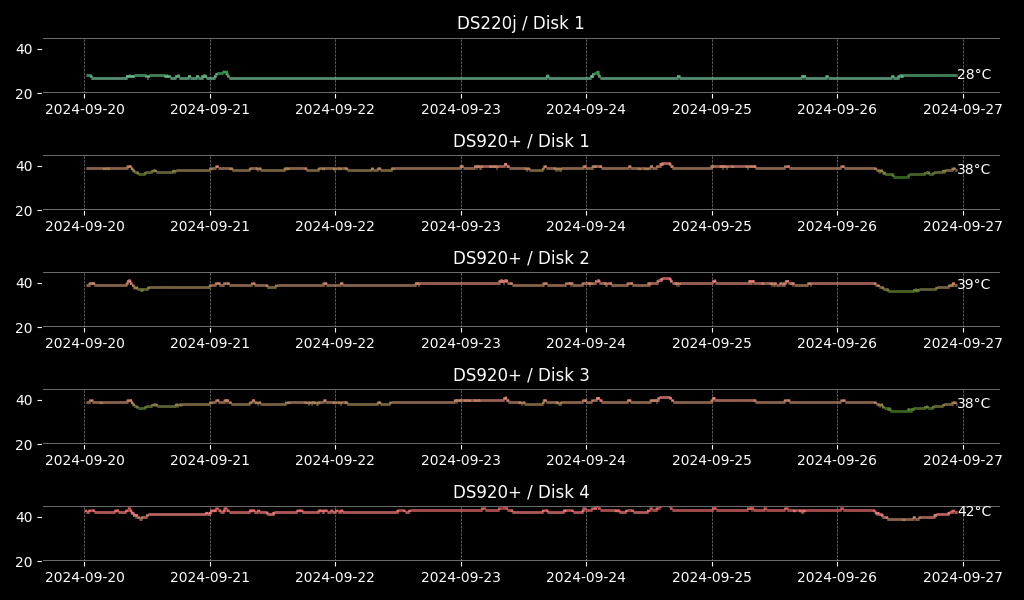
NAS HDD temperature
Building wenderful graph showing temperature of each drive in your NAS.

TL;DR - the repo is here.
I have two Synology NASs - at home and one backup at my brother’s place. I check the HDD temperature in Synology software from time to time. I wanted to set up a continuous monitoring system. There are various commercial options available via the SNMP protocol, but none of them made me really happy.
I have a tablet at my table, where I display various graphs, including temperature and air quality—I wanted to add the HDD temperature there.
Overall architecture
- There is a Docker container running a temperature gathering script. It sends the measurement to 2minlog.com portal.
- The display script at the portal generates the graph.
- I display the results via Img Tuner service.
Understanding the SNMP protocol
There are several python packages for SNMP. We went with pysnmp. There is wonderful chatbot available from their web page, prepared to talk about pysnmp. The chatbot wrote most of the code.
The documentation specifying the OID is available on the Synology web page. See section Synology Disk MIB OID: .1.3.6.1.4.1.6574.2.
Building the solution
- First, enable SNMP on your Synology NAS (Control Panel -> Teminal & SNMP -> SNMP -> SNMPv2 service + username + protocol: SHA + Passwd. You may keep Enable SNMP privacy disabled.
- Setup the new project 2minlog.com portal.
- Modify the synology-temperature script to include 2minlog.com credentials, SNMP Synology NAS credentials and IP address
- Run the script on Docker machine within Synology with
docker-compose up -dcommand. - Set the graphing script in 2minlog.com portal by copying the synology-graph.py script there.
- Set the display (e.g., set autorefresh and setup your tablet.
Enjoy wonderful graphs!