Wifi Arduino thermometer
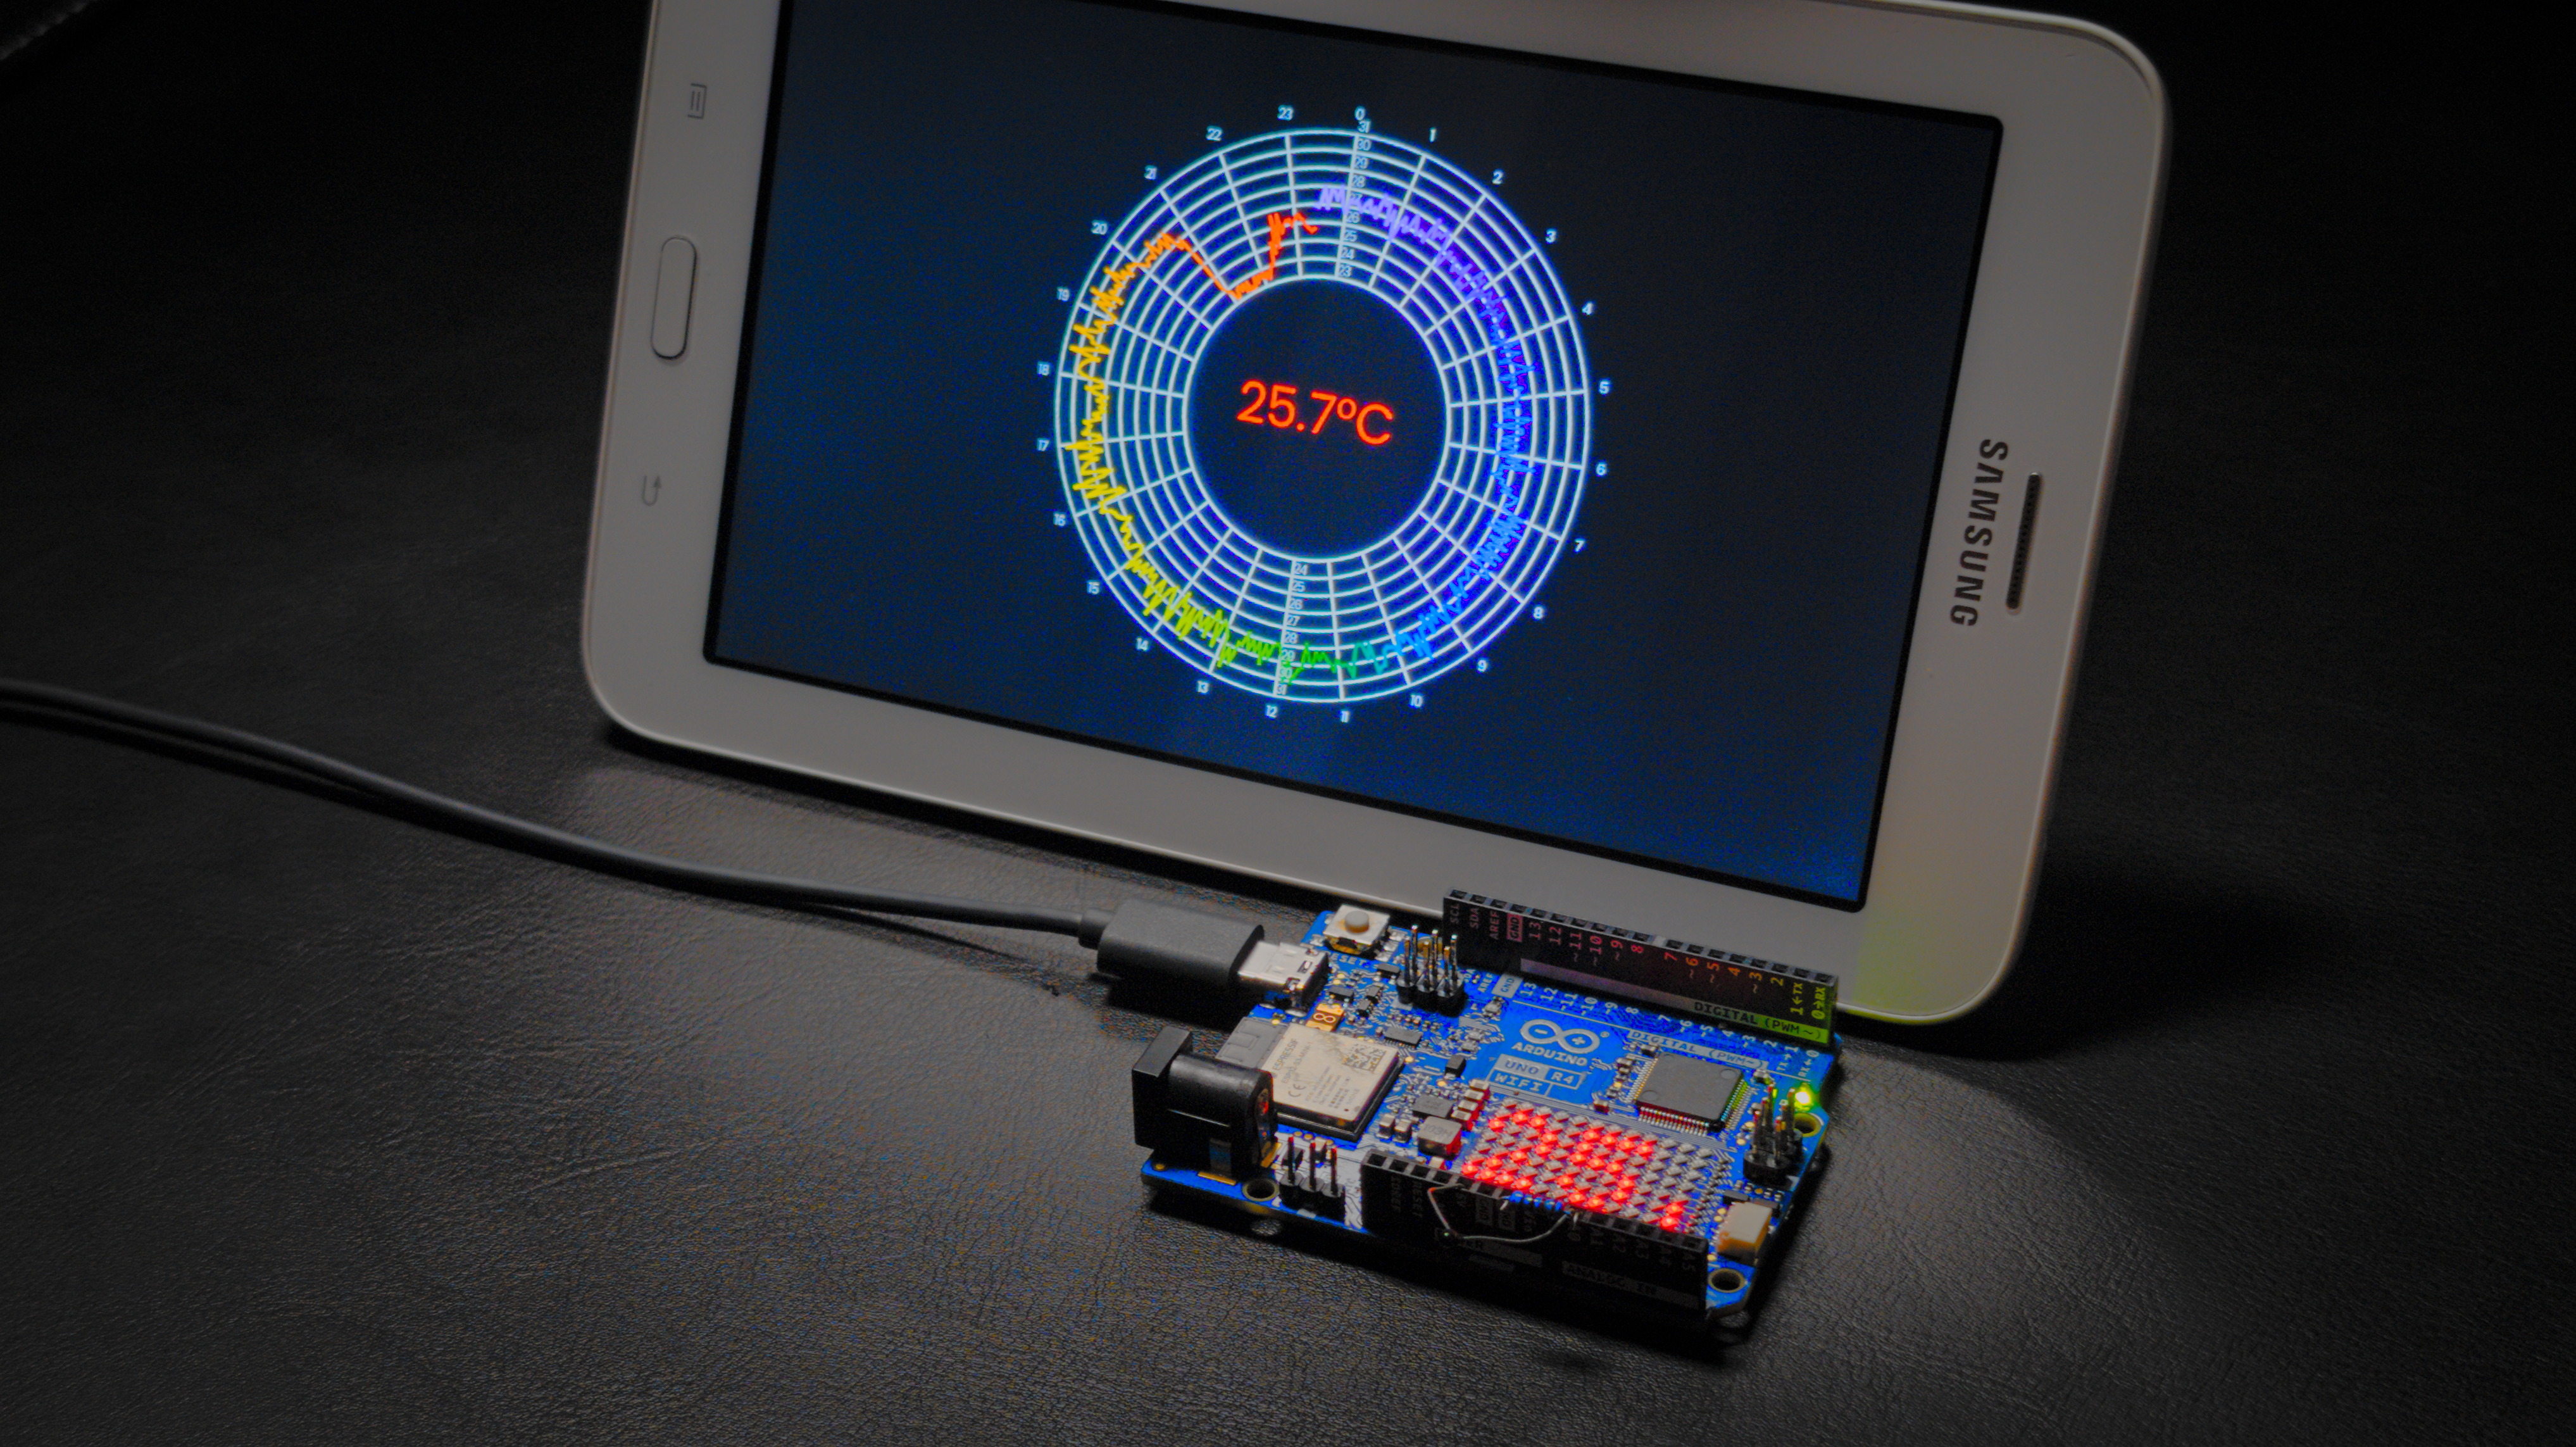
This is a simple Wifi Arduino thermometer tutorial. We will measure temperature with a thermistor, display results on a matrix LED display, send the records to 2minlog.com platform, and plot the results.
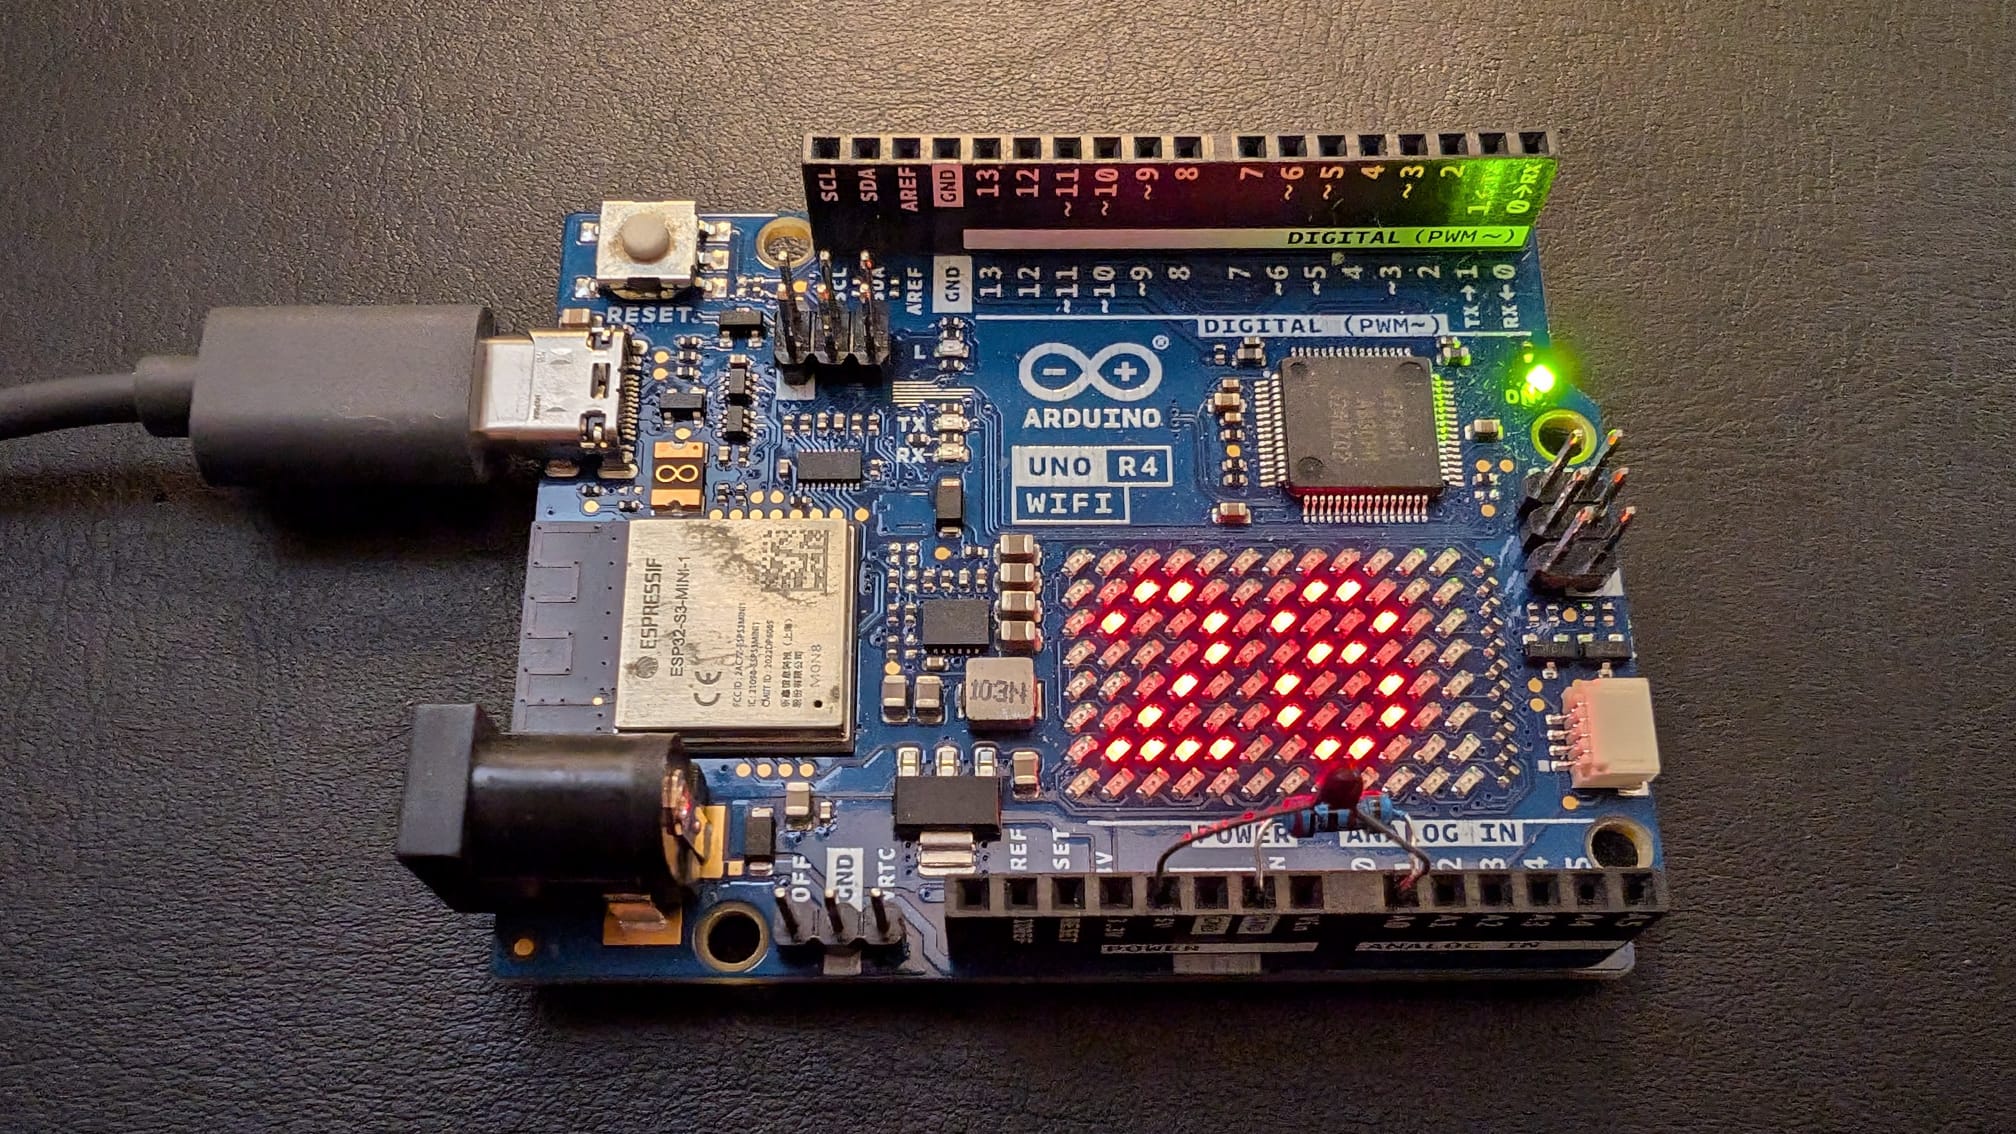
Bill of material:
- Arduino® UNO R4 WiFi,
- 10 kOhm thermistor with a negative temperature coefficient,
- Resistor 2 kOhm or similar,
- Some connection cables, breadboard, USB-C cable, and power supply.
- A reference thermometer for calibration
The thermistor is a cheap and simple component, but a calibrated temperature sensor is definitely recommended for real use.
Electrical wiring
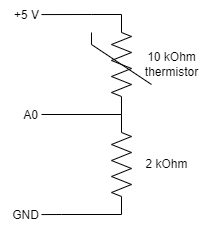
The thermistor has a resistance of 10 kOhm, which decreases with increasing temperature. Usually, at around 77 °F/25 °C, the resistance is around 10 kOhm, while at 120 °F/50 °C, the resistance drops to 3.5 kOhm. (For detailed calculation, look for Thermistor Equation and consult the datasheet of your thermistor.)
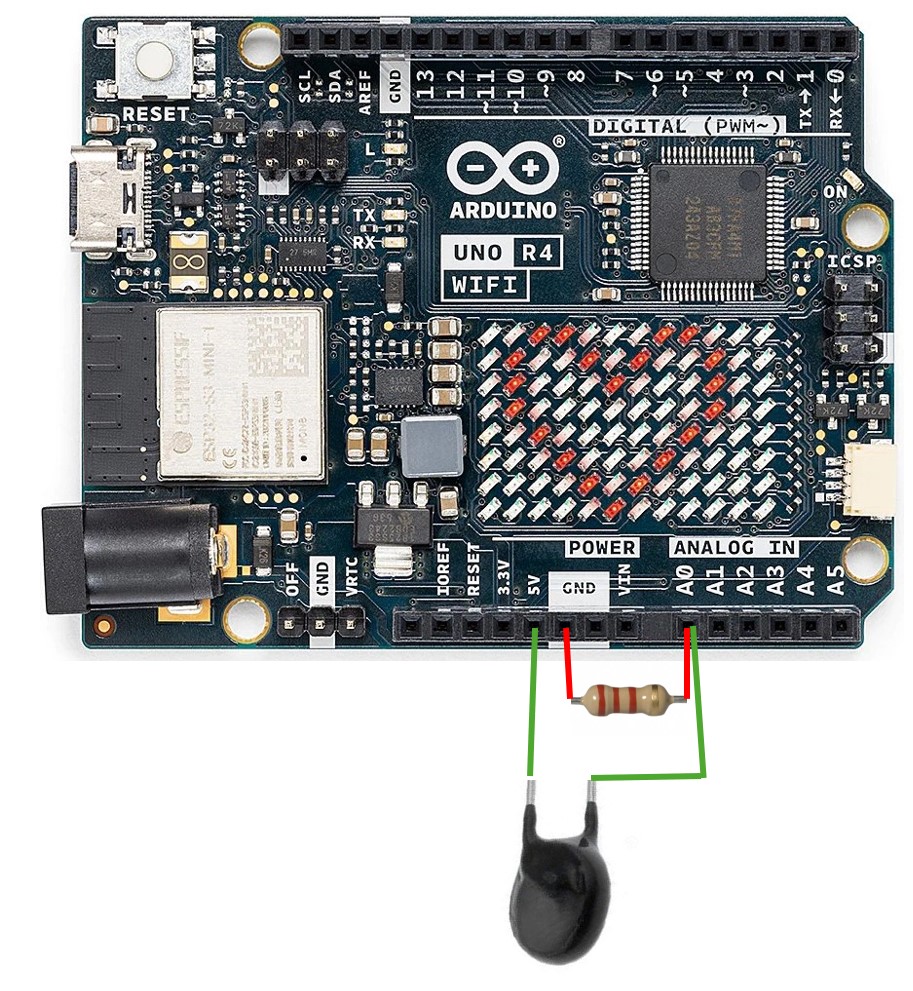
The resistors are connected in a voltage divider circuit, and the Arduino measures voltage at the divider output. We chose the second resistor of 2 kOhm. Connect the components to the corresponding pins of the Arduino board.
Arduino coding
Here is the code.
Level 1 - Getting the temperature
Key elements of the code:
- We will be reading the output on the Serial Monitor. Let’s set
Serial.begin(115200). You need to set the corresponding figure in your Arduino IDE. - We will use the least square linear regression to get temperature from voltage. It is a straightforward approach but works if the changes in the temperature are small. For more considerable temperature changes, you can, e.g., calibrate component parameters and use the thermistor equation and the voltage divider equation to get the voltage.
- We will average the temperature reading over several cycles.

You need to calibrate your sensor. You can view the reading on the serial console.
- Set the console to the correct speed (115,200 baud).
- Look for the
Levelmessage in the serial monitor - Place your Arduino in a warm and cold environment. Record the actual temperature (with a reference thermometer) and corresponding levels. You need to adjust the corresponding calibration arrays - e.g., you have recorded three levels for three temperatures. Here, more is better, and it should cover the whole temperature range of intended use, e.g., room temperature, hot outdoor and fridge. You may not want to use freezer, as linear interpolation covers well only small temperature range.
// You need to calibrate your thermometer with those two arrays
double temperatures[] = { 4.4,   25.4, 30.2 };
double levels[]       = {75.15, 180.9, 200};
Level 2 - Networking with Arduino
WiFi Networking with Arduino:
- You must set up the SSID and pass it to your WiFi.
- It goes in a loop. Test for the connection and set it up if it is unavailable.
Sending HTTP/HTTPS data:
- You need to include the
datasetSecretstring in your code. You will get it from the 2minlog portal. Server,port, andpathare already set.- Include the local server’s IP address if you want to run it locally.
- The values are passed to the server via URL query string.
Level 3 - LED matrix display
Displaying temperature on the matrix LED display.
- You need to install ArduinoGraphics library
- The library supports scrolling text.
Here is the complete code.
Deployment
Create a dataset and connect Arduino there
- Go to the 2minlog.com portal. Login and create a new data set.
- Copy the data set’s secret string to the Arduino code.
- Go to the data set settings, and rename the data set to, e.g.,
Arduino thermometer - Refresh the data set (or set auto refresh) to verify that the data are correctly passing from Arduino to 2minlog
Baseline graph
In 2minlog.com portal
- Go to Graphs and create a new graph.
- Go to the graph settings, and rename the graph to, e.g.,
Arduino thermometer - Go to the graph settings and Set the default data source to
Arduino thermometer.
You should get a graph like in the image below:
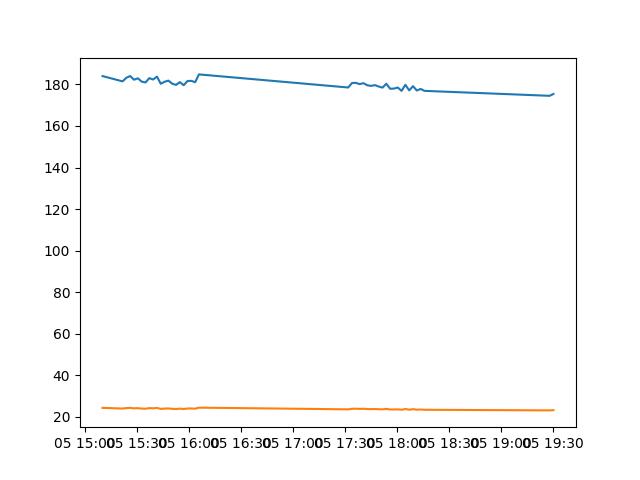
Awesome graph
You can continue code development in 2minlog.com portal or download the data and the code to your local environment and continue there.
If you want to continue on your local host
- Download the source code from the Graph details screen
- Go back to the Data set and download the csv from the settings “Download dataset as .csv”
- Follow the instructions in the code to install the required Python packages. You will also need to install Poppins Google font.
The source code is available here
Key elements:
- Polar graph with an empty center
- Displaying current temperature in the middle
- Black background, white axes, rainbow color graph
- Google font Poppins
- Two radial value labels
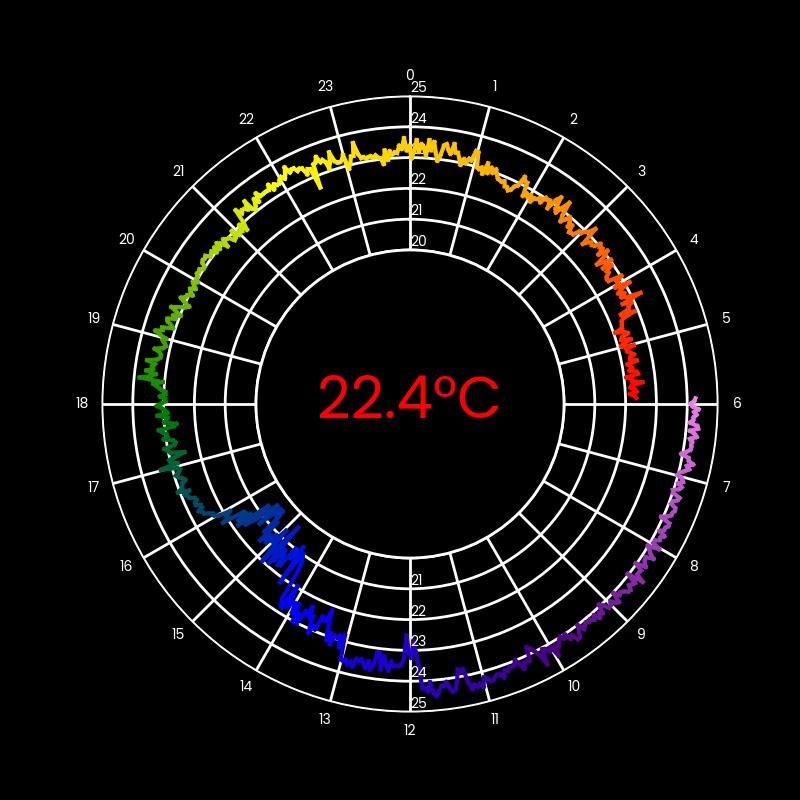
Display
As usual, you can display the image with autorefresh using imgtuner service: https://imgtuner.com/?img=https://api.2minlog.com/img?graphPublic=GPUB-xxxxxxxx-xxxx-xxxx-xxxx-xxxxxxxxxxxx
You can get the graph public string either in the graph settings menu or by clicking on the image of the graph in the system.
You have such a nice thermometer graph at the beginning of this article.