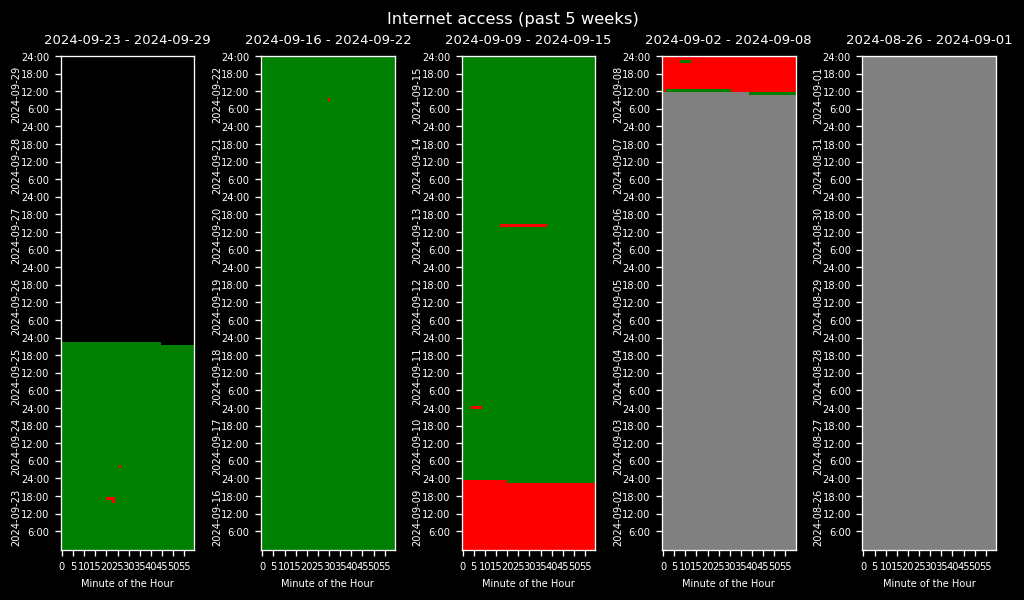
Monitoring internet availability
I was constantly worrying about the quality of the internet connection. How often is it down? Is there a pattern? How is the ISP keeping the system up and running? Is my router OK? If a system continuously pings a server, we could track how many ups and downs we have over a day, week, and month… Here we go!

Overall architecture
The system consists of two parts:
- A heartbeat script, which pings to 2minlog.com every minute
- A visulization script, which will color all successful pings with green and missing data with red color.
All the sources are here.
Heartbeat script
It is a simple script that pings the 2minlog.com server every 30 seconds in a minute.
You can deploy the script to any reliable server in your network, including network components capable of running such scripts. We have deployed the script to a NAS capable of running Docker. You need to start the image so that it restarts when the server starts. This can be done with the docker run --restart unless-stopped restart policy or using Docker compose. We went for the second option. Docker then started with the docker-compose up -d command.
Visualization script
There are a few components of the solution:
- Time stamps are UTC, not timezone aware. We need to convert it to our local time zone.
- We remove all seconds, keeping only minutes - as the minute timestamp is of interest
- We merge the data set with the every-minute dataset, having existing time stamps in green color We assign the remaining colors: older than the oldest recorded time by gray, time in the future in this week by black, correct time stamps by green, and missing by red.
- We plot 168 hours per week and left to right minutes per hour.
Download scripts from here.
The resulting image looks fantastic!
- You can see the time we set up the system.
- Everything before is grey
- Red internet outage when working on the deployment
- And actual, a few minutes-long outages over the past 2.5 weeks.