Quick Start Guide
This is a straightforward tutorial from the start to the end. We will measure ping latency to www.google.com and plot it to the graph.
Prerequisites:
- Windows or Linux machine
- Local installation of Python
- (Once the data ingestion and plotting are tested) subscription of 2minlog. It would help if you had your credit card ready.
Preliminary test - save and retrieve dummy data
Let’s start with a preliminary text. We’ve set up a project already for you to be able to test before you subscribe and commit your cash.
- Secret code: SEC-d811574a-b61e-4844-b61b-e06da34c6ef7
- Public code: PUB-5ae1e592-7bfc-417c-b14a-169d22f48d49
Paste this to URL of your browser: https://api.2minlog.com/log?datasetSecret=SEC-d811574a-b61e-4844-b61b-e06da34c6ef7&T=451. It will save Fahrenheit 451 to the Dataset. You should get an “OK” response.
Next, let’s retrieve the data. Download the csv here: https://api.2minlog.com/img?filenameExtension=csv&datasetPublic=PUB-5ae1e592-7bfc-417c-b14a-169d22f48d49. It is a public Dataset, and anybody (including, e.g., web crawlers) may send and get the data. If you want to be sure it is your data, you can include, e.g., your name https://api.2minlog.com/log?datasetSecret=SEC-d811574a-b61e-4844-b61b-e06da34c6ef7&T=451&name=JackRabbit. Download the CSV again and check for your name.
Ping & data ingestion
Now, you can create a batch file to ping Google and store results in the 2minlog portal.
If you are using Microsoft Windows, copy the script below to ping_google.bat.
@echo off
setlocal

:: Define dataset secret
set datasetSecret=SEC-d811574a-b61e-4844-b61b-e06da34c6ef7

:loop
:: Ping www.google.com and capture the average ping time
for /f "tokens=10 delims==m " %%a in ('ping www.google.com -n 1 ^| findstr /i "average"') do set pingtime=%%a

:: Display the ping time
echo Ping time to www.google.com: %pingtime% ms

:: Make a request to api.2minlog.com with the ping duration and Dataset secret
curl "https://api.2minlog.com/log?datasetSecret=%datasetSecret%&delay=%pingtime%&name=JackRabbit"

:: Wait for 60 seconds
timeout /t 60 /nobreak

:: Repeat the loop
goto loop

endlocal
Run the file and see the positive output:
C:\Users\jack.rabbit\Downloads>ping_google.bat
Ping time to www.google.com: 29 ms
OK
Waiting for  0 seconds, press CTRL+C to quit ...
Ping time to www.google.com: 106 ms
OK
...
If you are using Linux, you can have a very similar script:
#!/bin/bash

# Define Dataset secret
datasetSecret="SEC-d811574a-b61e-4844-b61b-e06da34c6ef7"

while true; do
  # Ping www.google.com and capture the average ping time
  pingtime=$(ping -c 1 www.google.com | grep "avg" | awk -F'/' '{print $5}')

  # Display the ping time
  echo "Ping time to www.google.com: $pingtime ms"

  # Make a request to api.2minlog.com with the ping duration and Dataset secret
  curl "https://api.2minlog.com/log?datasetSecret=$datasetSecret&delay=$pingtime&name=JackRabbit"

  echo

  # Wait for 60 seconds
  sleep 60
done
Run the script and check the “OK” after each call.
Next, let’s retrieve the data. Let’s also set the csv filename to ping_google.csv: https://api.2minlog.com/img?filenameExtension=csv&datasetPublic=PUB-5ae1e592-7bfc-417c-b14a-169d22f48d49&csvFileName=ping_google.
Plot the graph locally
There is a skeleton of the graph available https://raw.githubusercontent.com/X-Horzion/2minlog_public/main/examples/00_hello_world.py.
First, install required libraries:
pip3 install
We will have to modify the code:
- Filter out the only rows with
JackRabbitname asdf = df[df['name'] == 'JackRabbit'] - Set the input filename to
ping_googleasDATASET_NAMES = ['ping_google']
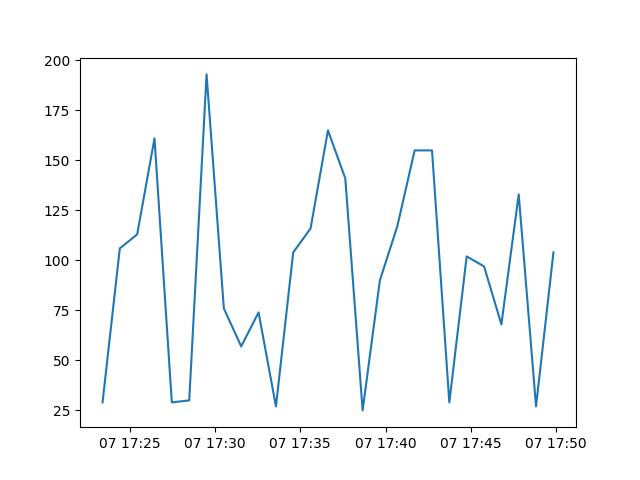
The updated code is available here. Run the code locally python3 00_hello_world.py and check output.jpg.

Now, you can improve your graph. Mathplotlib documentation is here. You can also get inspiration from other tutorials and documentation here.
You need to understand how the tier works. Pricing is here. There are three tiers available. They are limited by
- maximum number of seconds to prepare csv for download and process images
- maximum number of bytes both per hour. If you exceed the limit, image generation and data download will be disabled until the end of the given hour. This example takes 0.4s to generate and 0.04 MB to download the image. Therefore, you can safely use the image in an automated script, which refreshes itself every few minutes. If the CPU time or data/image download size is higher, you will either have to upgrade the tier or refresh the image less frequently.
If all looks good, proceed further.
Run the code in 2minlog
Now, you need to set up an account at 2minlog portal:
- Click on the top right corner, create an account, and log in.
- Click on the top right corner. Buy the subscription - e.g., Silver package.
- Verify Status on the user page - your selected subscription is active.
Create and set the Dataset:
- Go to Projects
- Click
Create a new Dataset, wait a few seconds - Click the setup gear on the newly created Data set
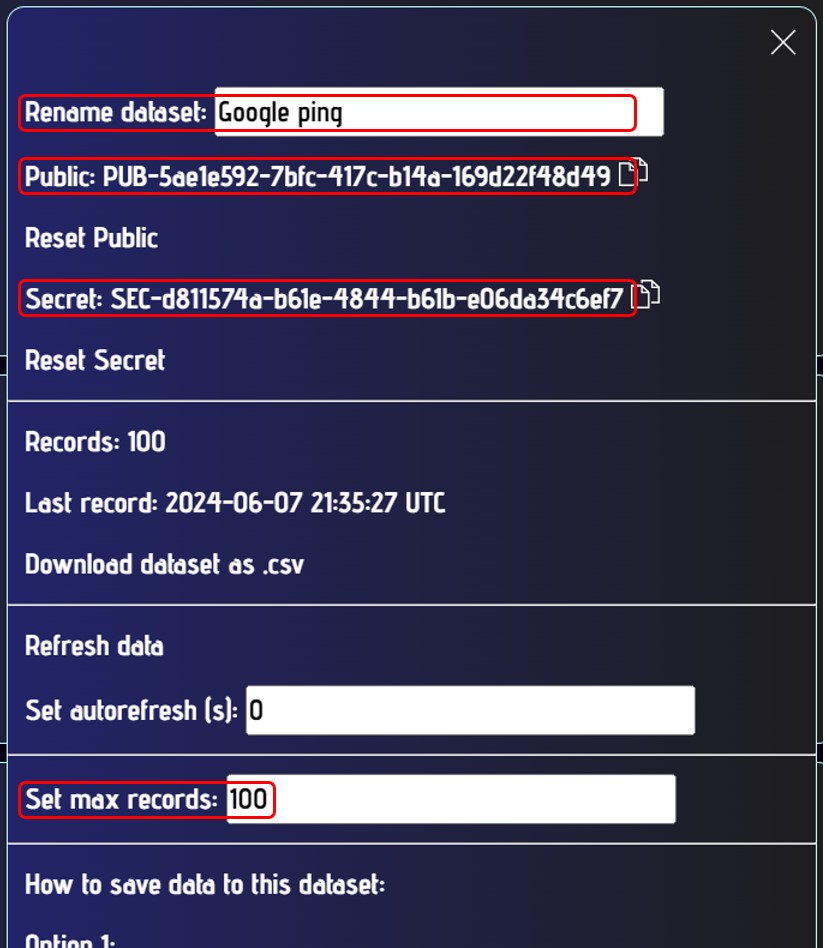
- Markdown Public and Secret codes
- Set max records to a reasonable number. The default is 10,000. If you keep the figure too high, you will quickly consume the tier limit.
- Rename dataset name to
Google ping. If you download the dataset as .csv (link on the card), it will automatically keep the name.

Next, you have to set the graph:
- Click on Graphs on the Projects page.
- Click on the card with plus in a circle.
- Click on the newly created card.
- Click on the gear set up icon.
- Click on
Set default data source. - Select
Google pingproject. - Let’s plot the last 12 hours. Set
Dataset historyto12h. Then, the code will receive only the indicated period. - Upload the code. Click on
Deploy. - You should see the same graph as in the previous step above.
Display the graph independently.
- In the graph card, click on the gear set up icon.
- Note down the Public code. The graph address contains this code.
- You can open the graph directly by clicking on the URL stated there. It looks like https://api.2minlog.com/img?graphPublic=GPUB-xxxxx-xxxx-xxxx-xxxxxxxxxxxx.
You can use https://imgtuner.com service to automatically display the image in full screen and refresh the image every 5 minutes. You can display the image under this URL: Ahttps://imgtuner.com/?img=https://api.2minlog.com/img?graphPublic=GPUB-xxxxx-xxxx-xxxx-xxxxxxxxxxxx.
You now have an image you can display, e.g., on your web browser or a tablet, which autorefreshes once in a while and gathers information on Google ping delay.
Enjoy and let us know what you think on our social networks!